Purview DLP Incident Management (IM) – From Alert to Outcome #09
Purview DLP Incident Management (IM) – From Alert to Outcome #09
Phase 4 – Tools and Architecture
The DLP Tooling Decision Model.
Overview
Every DLP team eventually hits the same question: where should DLP incidents live? Defender XDR? SIEM (e.g. Sentinel)? ITSM (e.g. ServiceNow)? Some combination of all three?
The answer depends on your operating model, not on which tool has the longest feature list.
Quick recap
In Post 08, we closed Phase 3 by connecting incident closure back to programme improvement. The feedback loop from outcome to policy and process is what makes a DLP programme smarter over time.
Phase 4 shifts from the operational model to the architecture layer. The question here is not how incidents are handled, as we have covered that in detail. The question is where the infrastructure supporting that handling should live, and how the choice of tooling shapes what the programme can and cannot do.
Why this decision is harder than it looks
Microsoft gives you several places to manage DLP incidents. Each of them works. None of them works for every operating model. And most organizations end up using more than one, without having made a deliberate choice about which one owns what.
The result is a fragmented operational picture: alerts in Defender XDR, tickets in ServiceNow, logs in Sentinel, dashboards in Power BI, and all are loosely connected, with no clear system of record and no single view of an incident’s full lifecycle. That fragmentation is not a tooling failure, rather is a decision failure.

The purpose of this post is to give you a framework for making that decision deliberately.
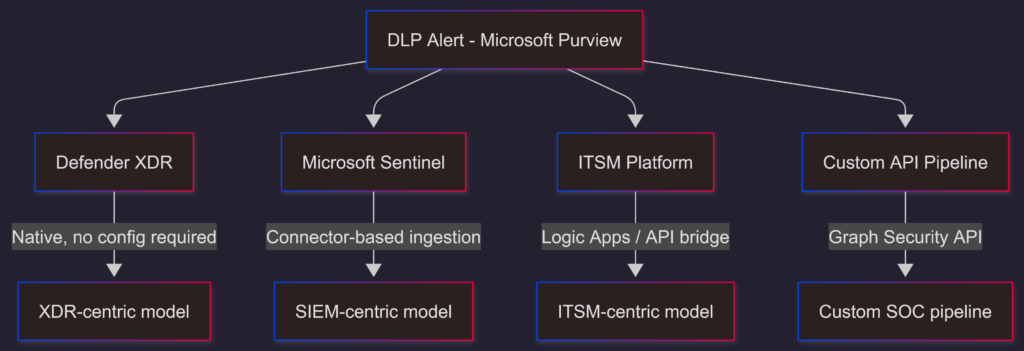
The Model Options
There are five distinct tooling models available for DLP incident management in the Microsoft ecosystem:
- Defender XDR: native incident management
- Microsoft Sentinel: SIEM-centric SOC model
- ITSM platforms: ServiceNow, Jira Service Management, or similar
- Microsoft Defender API / Graph Security API: custom integration pipelines
- Office 365 Management API: audit log and compliance event access
These are not mutually exclusive. Most mature environments use two or three of them. The question is which one is the system of record for DLP incidents, and which ones are supplementary.
Note:
Worth clarifying, Activity Explorer in the context of DLP incident investigation. It is a general-purpose data classification and activity visibility tool, not an incident management interface. It can be used across a broader set of scenarios:
- Data classification monitoring: tracking how sensitivity labels are being applied, changed, or removed across the tenant over time
- Label adoption reporting: understanding which labels are being used, by whom, and across which workloads
- Policy tuning: identifying activity patterns that inform whether DLP policies are scoped correctly before and after deployment
- Compliance auditing: reviewing user interactions with sensitive content for regulatory or internal audit purposes
- Oversharing assessment: spotting users or departments with disproportionate external sharing activity outside of any specific incident context
In the DLP incident management context, it is only one input into the investigation – not the primary interface. Defender XDR is where the incident lives; Activity Explorer is where you go for the broader activity picture around it.
Comparing the models
| Criteria | Defender XDR | Sentinel | ITSM Platforms | Custom API |
|---|---|---|---|---|
| Setup complexity | Low – built in | Moderate – connector based | Moderate – API bridge required | High – fully custom |
| Data coverage | Full DLP incident and alert detail | Cross-platform security data | IT and security incidents | Fully customizable |
| Advanced queries | Advanced Hunting (KQL) | KQL and custom rules | Custom reports | Full custom query model |
| Automation | Built-in automation rules | Logic Apps and playbooks | Ticket automation workflows | Fully custom |
| Best fit | M365-native SOC teams | Mature SOC with multi-platform data | Compliance-led or ITSM-mature orgs | Advanced teams with custom tooling needs |
Model 1 – Defender XDR
Microsoft Defender XDR is where DLP incidents land natively. No connectors, ingestion pipeline, or additional configuration beyond what you already built in Purview are needed. Alerts correlate into incidents automatically, the three-tier RBAC model from Post 04 applies directly, and Advanced Hunting gives you KQL access to the full incident and evidence dataset.
This model works well when:
- Your SOC operates primarily within the Microsoft security ecosystem
- The DLP programme sits inside a security function that already uses Defender XDR for endpoint, identity, and email threat management
- You want incident management, investigation tooling, and response actions in a single interface
- You don’t have a mature SIEM deployment or the overhead of maintaining one
Where it shows limitations:
- Cross-platform correlation is constrained to Microsoft data sources, if your broader SOC ingests non-Microsoft telemetry, Defender XDR doesn’t see it.
- Reporting and dash-boarding options are functional but not highly customizable. Compliance and executive reporting typically requires something supplementary
- Long-term retention of incident data beyond Defender XDR’s default retention window (i.e. 6 months) requires exporting to a separate store
Model 2 – Microsoft Sentinel (SIEM-centric)
Microsoft Sentinel ingests DLP incident and alert data via the Microsoft Defender XDR connector, giving SOC teams a unified view of DLP alongside identity, endpoint, network, and application telemetry. Incidents can be managed in Sentinel directly or via the unified Sentinel-Defender experience in the Defender portal.
This model works well when:
- Your SOC manages security data from multiple platforms and needs a centralized view
- You have existing Sentinel investment and want DLP incidents to appear alongside other security incidents in the same queue
- Your automation requirements go beyond what Defender XDR’s built-in rules support. Sentinel playbooks via Logic Apps give you significantly more flexibility
- You need long-term data retention and custom KQL-based correlation rules across the full telemetry set
Where it shows limitations:
- Adds cost (this applies to all SIEM solutions not just Sentinel). Sentinel ingestion pricing scales with data volume, and DLP alert data can be significant in active environments
- Increases operational complexity. You now have two systems to maintain rather than one
- The Sentinel model works best when someone owns it properly; a half-configured Sentinel deployment is often worse than no Sentinel deployment
A basic Sentinel query example for DLP alert monitoring:
SecurityAlert
| where ProviderName == "Microsoft Data Loss Prevention"
| where AlertSeverity in ("High", "Medium")
| summarize AlertCount = count() by AlertName, bin(TimeGenerated, 1d)
| order by TimeGenerated descModel 3 – ITSM platform (ITSM-centric)
For organizations where incident lifecycle management lives in ServiceNow, Jira, or a similar ITSM platform, DLP incidents can be pushed into that system via Azure Logic Apps or the Microsoft Graph Security API.
The typical integration pattern:
DLP alert raised –> Defender XDR webhook or Logic App trigger –> ITSM ticket created with alert metadata –> ticket routed to SOC queue –> incident lifecycle managed in ITSM from that point.
This model works well when:
- Your organization has mature ITSM workflows and SLA management built around a platform like ServiceNow.
- DLP incidents need to be visible to teams who don’t have Defender XDR or Purview access, like IT operations, HR, Legal teams.
- Compliance reporting is built around ITSM ticket data rather than security portal data
- You need formal change management and approval workflows as part of containment and remediation
Where it shows limitations:
- ITSM platforms don’t have native DLP investigation tooling, analysts still need Defender XDR or Purview access for the actual investigation; the ITSM is the workflow layer, not the investigation layer
- The integration requires maintenance. Logic App connectors, API authentication, schema mapping between DLP alert fields and ITSM ticket fields all need to be owned and kept current
- Alert enrichment is constrained to what the Logic App pulls at trigger time; real-time investigation updates don’t flow back automatically without additional plumbing
- The integration is typically one-way, alerts and incidents flow from Defender XDR into the ITSM tool, but updates made in the ITSM ticket don’t sync back to Defender without custom flows. This leaves incidents in Defender looking untouched: no status changes, no assignment, no resolution. Beyond the obvious reporting gap, that stale state becomes a problem if you later introduce AI-assisted triage or investigation tooling, those tools reason over incident state, and incidents that appear un-actioned are effectively new and require investigations.
Model 4 – Custom API pipeline
The Microsoft Graph Security API and Microsoft Defender API give advanced SOC teams programmatic access to DLP incident and alert data. This is the foundation for building custom dashboards, integrating with third-party SOC platforms, or building enrichment pipelines that combine DLP data with non-Microsoft telemetry.
This model works well when:
- Your SOC uses a third-party SIEM or SOAR platform (Splunk, QRadar, Palo Alto XSOAR) that might not have native Microsoft connectors
- You have specific reporting or correlation requirements that no out-of-the-box integration supports
- You are building the private preview Graph API enrichment integration covered later in this series
Where it shows limitations:
- Requires development and maintenance investment. This is not a configure-and-forget option
- API rate limits, schema changes, and authentication token management all add operational overhead
- The build cost is often underestimated; what starts as a “quick integration script” tends to become a maintained internal service (I am guilty of that one personally
 )
)
The Office 365 Management API – a specific note
The Office 365 Management API is sometimes positioned as a DLP integration option. It surfaces audit log events including DLP rule match data, but it is not an incident management API. It provides compliance event data, not the correlated incident and investigation data that Defender XDR and the Graph Security API surface.
If your requirement is compliance audit logging and policy match event export, the Management API is appropriate. If your requirement is operational DLP incident management, it is the wrong tool for that job.
This is a distinction I covered in some depth back in 2021 (I am getting old ![]() ). If you want to understand what the Management API surfaces and a legitimate and well-documented use case for compliance reporting, the two-part series I wrote on the topic is still relevant: Part 1 and Part 2.
). If you want to understand what the Management API surfaces and a legitimate and well-documented use case for compliance reporting, the two-part series I wrote on the topic is still relevant: Part 1 and Part 2.
The reporting gap it was filling – meaningful DLP and label insights from audit activity data, without building custom infrastructure – was exactly the problem I later helped address through the internal RAMP project (Reporting and Analytics for Microsoft Purview). RAMP delivered pre-built Power BI dashboards over unified audit log data: DLP policy match reports, label activity reports, alert and incident summaries, the kind of out-of-the-box insight that compliance and security teams had been asking for. The validated learnings from that project fed directly into what Microsoft shipped as Purview Posture Reports, now a native in-product capability covering DLP policy effectiveness, top violators, most triggered rules, and label adoption posture.
It is genuinely satisfying to see an idea go from a custom-built preview solution to a native product feature. That is how it should work
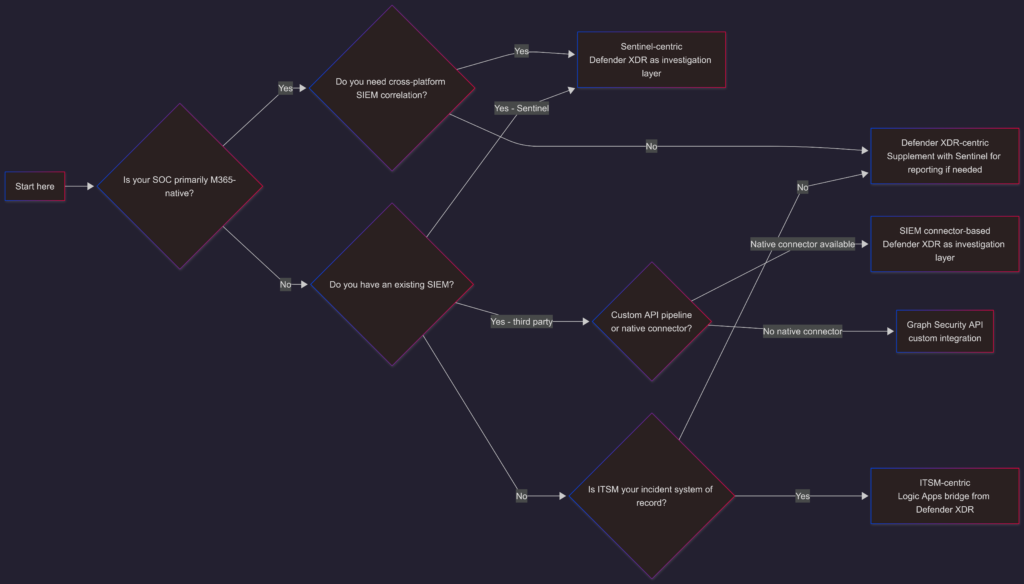
VisionStack’s DLP Tooling Decision Model
Rather than prescribing a single tooling approach, the useful question is: what does your operating model require?
this is where VisionStack’s DLP Tooling Decision Model becomes useful ![]()
A few principles that hold regardless of which model you choose:
- One system of record: Whichever tool owns the incident lifecycle, it should be one tool, not split across Defender XDR and ServiceNow with manual synchronization. Pick a primary and treat everything else as supplementary.
- Defender XDR as the investigation layer: Even in Sentinel-centric or ITSM-centric models, Defender XDR remains the best interface for the actual investigation work, evidence access, Advanced Hunting, response actions. The other tools handle workflow and reporting; Defender XDR handles investigation.
- Don’t architect for the demo: Custom API pipelines and full Sentinel deployments look impressive in architecture diagrams. They also require ongoing maintenance. Right-size the tooling to your team’s actual capacity and operational maturity.
What’s coming next
The DLP Tooling Decision Model tells you which architecture pattern fits your operating model. The next post goes one level deeper into each pattern, the specific integration configurations, data flows, and design considerations for building each one in practice.
0 comments